Insights Panel
Understand query costs before you run them and optimize performance after execution.
Open: Editor toolbar → Insights icon, or Cmd+K → "Show Prism Insights"
Overview
The Insights Panel provides two types of analysis:
| Tab | When | What |
|---|---|---|
| Cost | Before running | Estimates costs, identifies expensive sections |
| Execution | After running | Shows how BigQuery processed your query |
Optimize before running (reduce cost) or after (identify bottlenecks).
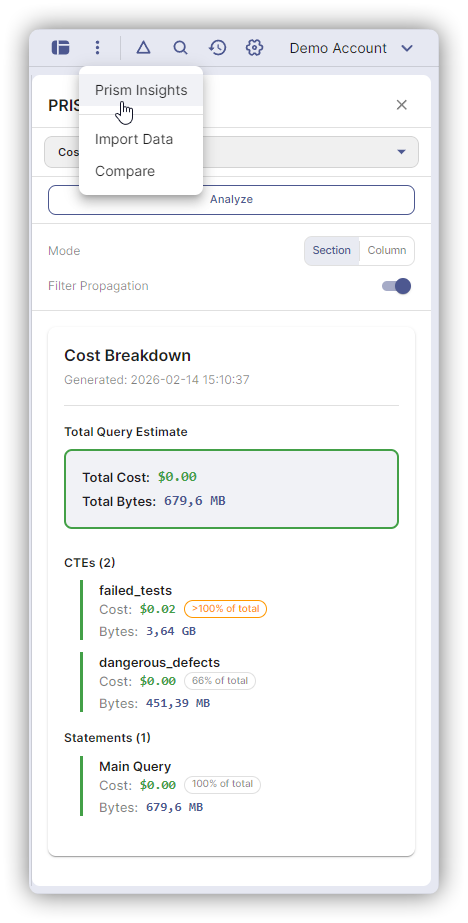
Cost Tab
Click Analyze to estimate costs without running the query. Uses BigQuery dry runs, which are free.
Total Query Cost
Shows the estimated cost and data processed for your entire query:
Estimated Cost: $0.032
Data Processed: 5.12 GB
Pricing: On-demand ($6.25/TB)
Section Breakdown
See which parts of your query cost the most. Querylab.io breaks down costs by CTEs, pipe operations, and subqueries:
CTE Breakdown:
├─ raw_data:      $0.015 (60%) - 3 GB
├─ filtered:      $0.005 (20%) - 1 GB
└─ aggregated:    $0.005 (20%) - 1 GB
This reveals which sections to optimize first. A CTE that accounts for 60% of costs is worth optimizing; one at 5% probably isn't.
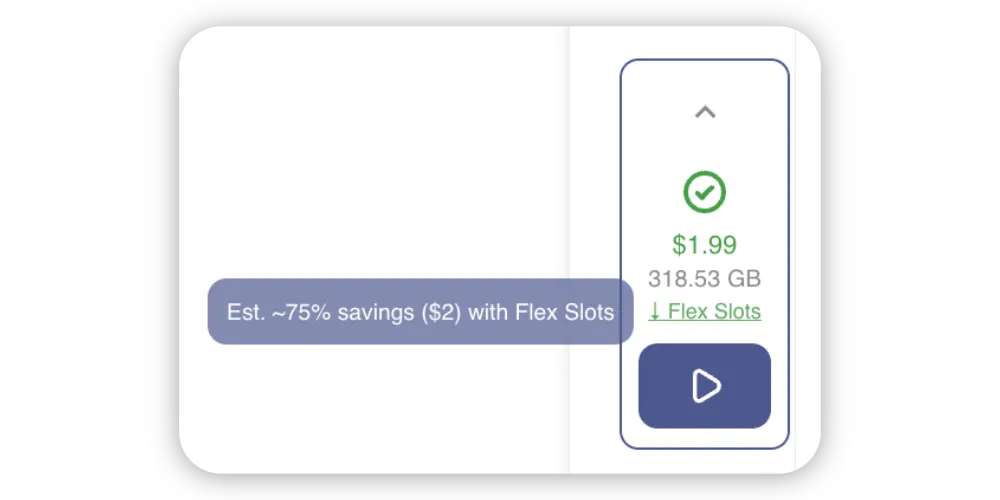
Price Comparison
If you have reservation pricing, the panel compares both models:
On-demand:     $0.63
Reservation:   $0.00 (already paid)
Savings:       100%
See Pricing Comparison for configuration.
Analysis Modes
| Mode | Speed | Use When |
|---|---|---|
| By Section | Fast | Default. Shows cost per CTE/pipe/subquery |
| By Column | Slower | Need granular per-column costs |
"By Column" runs multiple dry runs (one per column) to show exactly which columns cost the most. Useful for wide tables where you're selecting many columns.
Filter Propagation
When enabled (default), Querylab.io pushes WHERE filters back to earlier CTEs to show more realistic cost estimates.
Example: If your final SELECT has WHERE date > '2024-01-01', filter propagation applies that filter when estimating costs for upstream CTEs, giving you estimates closer to what BigQuery will actually scan.
This mimics BigQuery's own filter pushdown optimization. Without it, CTE cost estimates would show full table scans even when filters reduce actual data processed.
Execution Tab
After running a query, switch to the Execution tab to see how BigQuery processed it.
Execution Plan
A stage-by-stage visualization showing how BigQuery executed your query:
- Read stages: Which tables and partitions were scanned
- Compute stages: Filters, joins, aggregations, and transformations
- Output stages: Final result assembly
Cmd+Click (Mac) / Ctrl+Click (Windows) any stage to jump to the corresponding SQL in your editor.
Slot Usage
For reservation-based queries, see real-time slot consumption per stage. This helps identify stages that could benefit from more slots or query optimization.
When to Use
| Situation | Action |
|---|---|
| Before running expensive query | Open Insights → Analyze → Check cost |
| Query costs more than expected | Analyze → Find expensive CTEs |
| Query runs slowly | Run query → Execution tab → Find bottleneck |
| Comparing on-demand vs slots | Analyze → Check Price Comparison |
| Optimizing a CTE | Analyze → Note cost → Optimize → Analyze again |
| Want to see column data flow | Open lineage panel → Trace columns |