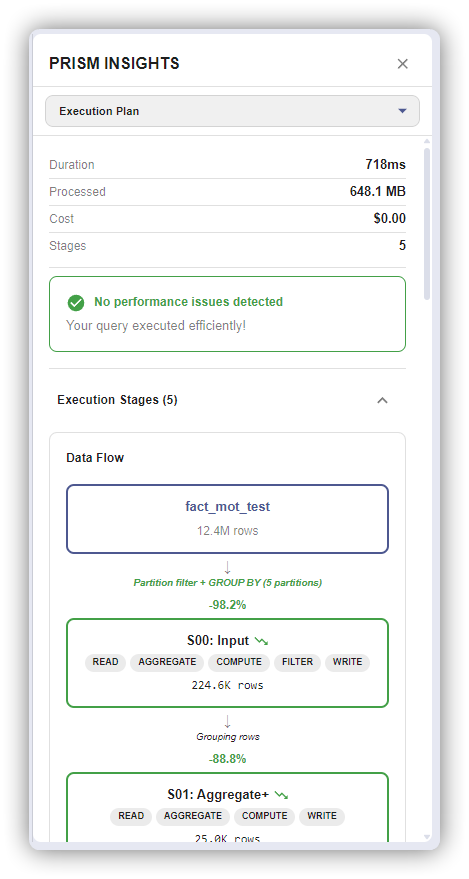
Execution Plan
Visualize how BigQuery processed your query to identify performance bottlenecks.
Accessing the Plan
- Execute a query
- Click "View Execution Plan" in results section
Or from Query History: select a query → "View Execution Plan"
What It Shows
Stage Diagram
┌──────────────────┐
│ Stage 1: Read    │
│ 45.2 GB read     │
│ 2.3s             │
└────────┬─────────┘
         ▼
┌──────────────────┐
│ Stage 2: Filter  │
│ 1.2 GB output    │
│ 0.8s             │
└──────────────────┘
Timeline View
Stage 1: ████████████████                    2.3s
Stage 2:                 ████████            0.8s
Stage 3:                         ██████████  1.1s
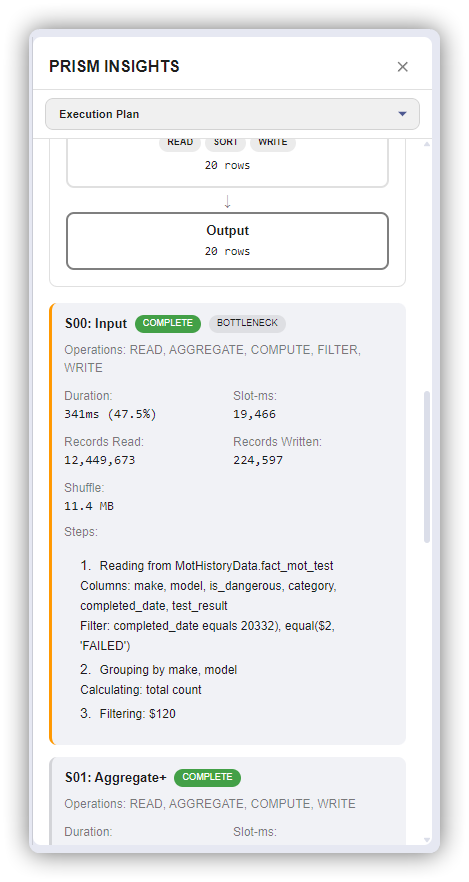
Stage Types
| Stage | What It Does | Optimization |
|---|---|---|
| Read | Scan table data | Add partition/cluster filters |
| Filter | Apply WHERE | Push filters to Read stage |
| Join | Combine tables | Filter before joining |
| Aggregate | GROUP BY | Reduce cardinality |
| Sort | ORDER BY | Add LIMIT, remove if not needed |
Red Flags
- Shuffle > Input: Inefficient data movement
- One stage 80%+ of time: Bottleneck
- Output >> Input: Cross join or data explosion